Introduction
Most hiring teams sit on mountains of data yet still make decisions by instinct. The business cost of that gap is steep: companies using data-driven hiring practices are 2x more likely to improve recruiting efficiency and 3x more likely to reduce mis-hires. In 2026's fiercely contested talent market, where the average role attracts 73 applicants globally, data-driven teams outpace intuition-driven ones by massive margins.
The adoption trend is clear: 84% of talent acquisition teams now use analytics to inform their strategies. The problem is 87% still rely on manual spreadsheets to track outcomes, leaving most teams stuck in reactive reporting rather than strategic forecasting.
This guide covers:
- What recruitment analytics actually is
- The four maturity levels that separate basic reporting from predictive intelligence
- The metrics that drive real hiring improvements
- How to implement analytics step-by-step
- What AI is changing in 2026
TLDR:
- Data-driven hiring teams are 2x more efficient and 3x better at reducing mis-hires than intuition-driven teams
- Only 15% of organizations use predictive or prescriptive analytics—most remain stuck in basic reporting
- Key metrics like time-to-hire and quality-of-hire only matter when tied to real decisions, not just dashboards
- AI is moving recruitment analytics from "what happened" to "what should we do next" at unprecedented speed
- Successful implementation hinges on data integration, clear business questions, and actionable KPIs
What Is Recruitment Analytics?
Recruitment analytics is the structured collection, analysis, and interpretation of hiring data to improve talent acquisition decisions. Unlike general HR analytics, which spans workforce planning, performance management, and retention across the entire employee lifecycle, recruitment analytics focuses specifically on the hiring funnel—from sourcing candidates through onboarding new hires.
The practice transforms raw hiring activity into intelligence. Instead of wondering why a role took 60 days to fill or why offer acceptance rates dropped last quarter, recruitment analytics surfaces the answers through data patterns.
Data Sources That Feed Recruitment Analytics
Modern recruitment analytics pulls from multiple systems:
- Applicant Tracking Systems (ATS): Used by 78% of HR professionals and 97.8% of Fortune 500 companies, the ATS is the foundational source tracking candidate progression through every hiring stage
- Job boards and recruitment marketing platforms: Capture top-of-funnel engagement, application sources, and campaign performance
- Interview platforms: Record assessment scores, interviewer feedback, and candidate experience data
- HRIS and onboarding tools: Connect pre-hire data to post-hire performance and retention outcomes
- Background check and reference systems: Add compliance and risk data at the bottom of the funnel
The value comes not from collecting data but from connecting these sources to spot patterns. When those connections are in place, the business impact is measurable: organizations with mature analytics capabilities are 3.1x more likely to outperform their industry peers on revenue growth and talent retention.
Who Benefits from Recruitment Analytics
Recruitment analytics serves every layer of the hiring function:
- Recruiters gain operational clarity on where bottlenecks occur, which sourcing channels perform, and how to allocate time effectively
- Hiring managers receive better-qualified candidates because data surfaces what "good" looks like for each specific role
- TA leaders can align hiring strategy with business goals, demonstrate ROI, and forecast capacity needs with confidence
The 4 Types of Recruitment Analytics
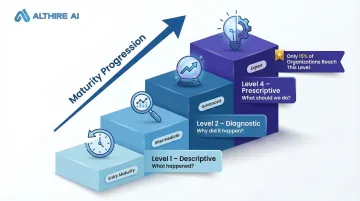
Recruitment analytics sits on a maturity spectrum with four distinct levels. Most teams operate at level one—able to describe what happened, but not diagnose why or predict what comes next. Each step up that spectrum unlocks more actionable insight.
| Level | Type | Question Answered | Maturity |
|---|---|---|---|
| 1 | Descriptive | What happened? | Entry |
| 2 | Diagnostic | Why did it happen? | Intermediate |
| 3 | Predictive | What will happen? | Advanced |
| 4 | Prescriptive | What should we do? | Expert |
Descriptive Analytics
Descriptive analytics answers "what happened?" This is the retrospective layer—tracking total hires, applicant volume, average time-to-hire, and other historical metrics. It's where most teams start because it requires only basic reporting capabilities.
Descriptive analytics is necessary but not sufficient. Knowing that time-to-hire averaged 45 days last quarter doesn't tell you why or what to change. It establishes the baseline but doesn't drive decisions.
Diagnostic Analytics
Diagnostic analytics answers "why did it happen?" This level drills into root causes behind outcomes. Why did a specific sourcing channel underperform? Why did offer acceptance drop in Q3? Why do technical candidates drop off after the second interview?
Diagnostic analytics requires comparing and cross-filtering metrics, not just viewing them. You're segmenting by role type, hiring manager, or time period to isolate the variable causing the problem—not just observing that a problem exists.
Predictive Analytics
Predictive analytics uses historical patterns to forecast future outcomes—which candidates are likely to succeed, when attrition will spike, which roles will be hardest to fill. It turns past hiring data into a forward-looking planning tool.
AI and machine learning are making predictive analytics accessible to mid-market teams, not just enterprises. Algorithms can now analyze thousands of past hires to identify which interview scores, assessment results, or sourcing channels correlate most strongly with long-term performance and retention.
Prescriptive Analytics
Prescriptive analytics is the highest maturity level. It doesn't just surface what's happening—it recommends what to do about it. Practical applications include:
- Prioritizing sourcing channels based on predicted quality-of-hire
- Flagging interview stages with high candidate drop-off risk
- Recommending interview panel compositions to reduce bias
Prescriptive analytics requires strong data infrastructure and AI-powered tooling. Only 15% of organizations operate at this level, but those that do consistently hire faster and with measurably better outcomes.
Key Recruitment Metrics to Track in 2026
Not all metrics are equally useful. Teams should track what they can act on, not everything they can measure. The goal is a focused, meaningful set of KPIs that drive decisions rather than vanity metrics that look impressive but change nothing.
Time-to-Fill and Time-to-Hire
These are distinct metrics often confused:
- Time-to-fill measures the calendar days from job opening to accepted offer, reflecting organizational process efficiency
- Time-to-hire measures the days from candidate entering the pipeline to offer acceptance, reflecting candidate experience and funnel speed
Both matter. Time-to-fill reveals how quickly your organization can respond to hiring needs. Time-to-hire measures how efficiently you move candidates through stages once they're in your pipeline.
SHRM's 2025 benchmarking survey reports median time-to-fill of 44 days for non-executive roles and 45 days for executive roles. SmartRecruiters found a global median of 38 days across 89 million applications, demonstrating that top-performing organizations move faster than the average.
Source of Hire and Cost-per-Hire
Source of hire tracks which channels — job boards, referrals, LinkedIn, agencies — actually convert to hires, not just applicants. Cost-per-hire divides total recruitment investment by number of hires made.
Understanding source effectiveness drives budget allocation. Job boards produce 43% of hires but often at lower conversion rates, while referrals and internal mobility generate 11-15% of hires with superior retention and faster time-to-productivity.
Cost-per-hire varies by seniority. SHRM reports median cost-per-hire of $1,200 for non-executive roles but $10,625 for executive roles—nearly 9x higher. Organizations must segment metrics by role level to avoid skewed averages that obscure reality.
Candidate Conversion Rate and Offer Acceptance Rate
Candidate conversion rate tracks how many candidates move stage-to-stage through your funnel, serving as a funnel health indicator. Drops at specific stages point to very specific problems—if 60% of candidates disappear after the technical interview, that stage needs redesign.
Offer acceptance rate signals employer brand strength and compensation competitiveness. Gem reported an 82% OAR across 1.2 million hires in 2025, while Ashby's analysis found business roles average 84% acceptance but technical roles lag at 73%. Low acceptance rates indicate market misalignment or candidate experience failures.
Quality of Hire
Quality of hire is the most complex but most valuable metric: it connects pre-hire data (interview scores, assessment results) to post-hire performance (ratings, retention, ramp time). Despite its importance, only 20% of organizations track it.
The core challenge is building the data bridge between pre-hire signals and post-hire outcomes. Platforms like AltHire AI generate structured interview reports with dimensional performance scores that feed directly into quality-of-hire analytics. When you can correlate which interview signals predict 12-month performance, you can optimize your entire hiring process around those signals.
Interview-Stage Analytics
Most teams track pipeline metrics but neglect what happens inside interviews—interviewer consistency, question effectiveness, candidate experience scores at the interview stage. This is an underused but high-impact analytics area in 2026.
Interview-stage data reveals:
- Whether different interviewers score similar candidates consistently
- Which questions differentiate top performers from average ones
- Where candidate experience breaks down in the process
- How scoring patterns shift across roles, teams, or time periods
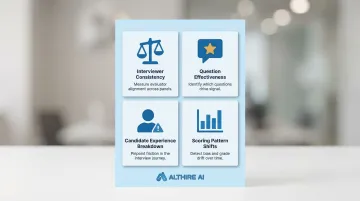
Organizations using AI-powered interview platforms capture this data automatically — turning what was previously anecdotal feedback into a measurable, improvable system.
How to Use Recruitment Analytics: A Step-by-Step Approach
Analytics is only valuable when connected to decisions and actions—not just dashboards. This implementation roadmap translates data into hiring improvements.
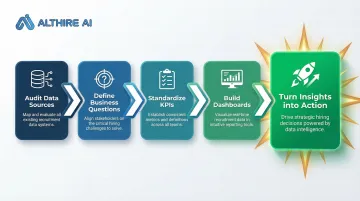
Step 1: Audit Your Current Data Sources
Start by mapping all existing data touchpoints: ATS, interview tools, HRIS, job boards. Identify what data is captured, where it lives, and what's missing.
Siloed data is the most common reason analytics efforts stall. 64% of HR leaders cite data quality as the top barrier to effective people analytics, and 55% of organizations use three or more HR systems that don't fully integrate.
If your interview data lives in one system, your ATS data in another, and your performance data in a third, connecting them becomes the first priority.
Step 2: Define the Questions You Need to Answer
Effective analytics starts with business questions, not metrics. Examples:
- Where are we losing candidates in the funnel?
- Which source produces our best performers?
- Why did time-to-fill spike for engineering roles last quarter?
- Which interview stages predict 12-month retention?
Defining the question first ensures you collect and analyze the right data rather than drowning in irrelevant reports. Every metric should answer a specific business question that leads to a decision.
Step 3: Choose and Standardize Your KPIs
Select 5-8 KPIs tied to specific recruitment goals: speed, quality, cost, and diversity. Teams need standardized definitions—if two recruiters measure "time-to-hire" differently, the data becomes meaningless. For each metric, document:
- How it's calculated and what data sources feed it
- Who owns it and who reviews it
- Which time periods and segmentation criteria apply
Step 4: Build Dashboards and Reporting Rhythms
Translate metrics into usable dashboards: real-time operational views for recruiters vs. strategic monthly reports for TA leaders.
Connect tools that unify your data pipeline. Platforms like AltHire AI support 20+ ATS integrations, syncing interview data alongside pipeline metrics automatically—reducing manual data stitching and spreadsheet maintenance. When data flows seamlessly between systems, dashboards stay current without manual updates.
Step 5: Turn Insights into Action
Most teams build dashboards and stop there. The real value comes from connecting what the data shows to what your team actually does next.
Concrete examples:
- If candidate drop-off spikes at the technical interview stage, redesign the format or shorten the time commitment
- If a sourcing channel has high volume but low quality-of-hire, reallocate budget to higher-performing channels
- If offer acceptance rates drop below 75%, audit compensation benchmarks and candidate experience touchpoints
Every insight should trigger a hypothesis, a test, and a process change. Teams that close this loop consistently outperform those that treat analytics as a reporting exercise.
Common Challenges in Recruitment Analytics
Data Quality and Fragmentation
Dirty, inconsistent, or siloed data is the root cause of most failed analytics initiatives. 87% of TA teams leveraging analytics still rely on manual spreadsheets to track key outcomes, creating error-prone, time-consuming workflows.
Practical fixes:
- Establish data governance policies defining standards for candidate records, source attribution, and stage definitions
- Enforce ATS hygiene standards—require complete, consistent data entry at every stage
- Invest in integration tools that connect disconnected systems automatically
- Audit data quality quarterly, fixing inconsistencies before they compound
Lack of Analytics Skills on TA Teams
Many recruiters excel at relationship-building but lack data interpretation skills. Only 31% of HR leaders report having sufficient analytical talent within their HR function to execute on people analytics.
Solutions:
- Upskill through training—teach recruiters to read dashboards, interpret trends, and ask analytical questions
- Embed an analytics partner or HR data analyst within the TA team
- Use tools that deliver insights automatically, so teams don't need to build queries themselves. AI-powered platforms can flag anomalies and recommend actions without requiring SQL skills
Vanity Metrics and Misaligned KPIs
Optimizing for easy-to-measure metrics (like application volume) that don't connect to hiring quality or business outcomes wastes time and budget. High application volume means nothing if conversion rates and quality-of-hire remain low.
Focus on metrics that link directly to decisions. A useful rule of thumb: if you can't articulate what action you'd take based on a metric moving up or down, don't track it.
To keep KPIs actionable:
- Assign a clear owner to every metric
- Define a threshold that triggers a process change
- Review KPI relevance quarterly as hiring goals shift
How AI Is Transforming Recruitment Analytics in 2026
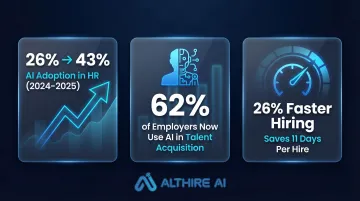
AI moves recruitment analytics from descriptive to predictive and prescriptive—automatically surfacing patterns across large datasets that would take analysts weeks to uncover manually. AI adoption in HR jumped from 26% in 2024 to 43% in 2025, and within talent acquisition specifically, 62% of employers now use AI.
Organizations utilizing AI in recruiting processes hire 26% faster, saving an average of 11 days per hire.
AI-Powered Capabilities Entering the Mainstream
Candidate fit scoring: AI analyzes historical hiring data to predict which candidates will succeed in specific roles, scoring applicants based on patterns correlated with long-term performance and retention.
Interview sentiment and structure analysis: Platforms like AltHire AI generate structured, objective scoring data automatically from AI-powered interviews, feeding directly into quality-of-hire analytics without manual data entry. Candidates are evaluated across customizable dimensions—technical proficiency, communication, problem-solving—with anomalies flagged in real time.
Predictive attrition modeling: AI forecasts which roles will be hardest to fill based on historical difficulty, market conditions, and internal turnover patterns, allowing teams to build candidate pipelines before roles open.
Automated sourcing channel optimization: AI tracks which channels produce the highest-quality hires and recommends budget reallocation based on ROI.
The Bias-Reduction Imperative
AI-driven analytics can flag demographic patterns that suggest bias at specific funnel stages—enabling fairer, more auditable hiring. That same capability, however, cuts both ways: AI introduces serious bias risks when left unmonitored. A 2024 University of Washington study analyzing Large Language Models found they favored white-associated names 85% of the time in resume screening and never favored Black male-associated names over white male-associated names.
Regulatory frameworks are tightening:
- NYC Local Law 144 requires annual independent bias audits for Automated Employment Decision Tools, though a 2025 NYS Comptroller audit found enforcement "ineffective"
- EU AI Act (applies August 2, 2026) classifies AI tools for employment and CV-sorting as "High-Risk," subjecting them to strict obligations before market deployment
Employers cannot rely on vendor claims of fairness alone. Independent bias audits and transparent candidate notifications are table stakes for legal and reputational protection.
Frequently Asked Questions
What is recruitment analytics?
Recruitment analytics is the process of collecting and analyzing hiring data to improve decision-making across the talent acquisition funnel, from sourcing through onboarding. It turns raw hiring activity into actionable intelligence for faster, more accurate decisions.
How to use data analytics in recruitment?
Start by auditing your data sources, then define the business questions you need to answer — where candidates drop off, which sources produce top performers. Select 5-8 KPIs tied to your goals, build real-time dashboards, and act consistently on what the data reveals.
What are the most important recruitment metrics to track?
The core five are time-to-hire, cost-per-hire, source of hire, offer acceptance rate, and quality of hire. The right mix depends on your organization's hiring goals: speed-focused teams prioritize time metrics, while quality-focused teams emphasize performance correlations and retention rates.
What is the difference between descriptive and predictive recruitment analytics?
Descriptive analytics reviews what has already happened, covering past hiring data like total hires and time-to-fill. Predictive analytics uses that historical data to forecast future outcomes, such as which candidates are likely to succeed or when attrition will spike.
How can AI improve recruitment analytics?
AI automates data collection and pattern recognition, enables predictive candidate scoring, and surfaces actionable insights in real time. This shifts teams from reactive reporting to proactive strategy, catching hiring problems before they escalate.